416 767 Parkland Drive, Clayton Park, NS (MLS® 202427452)
 Single Family For Sale
 416 767 Parkland Drive, Clayton Park, NS, B3S 1T1
MLS® # 202427452
$549,000
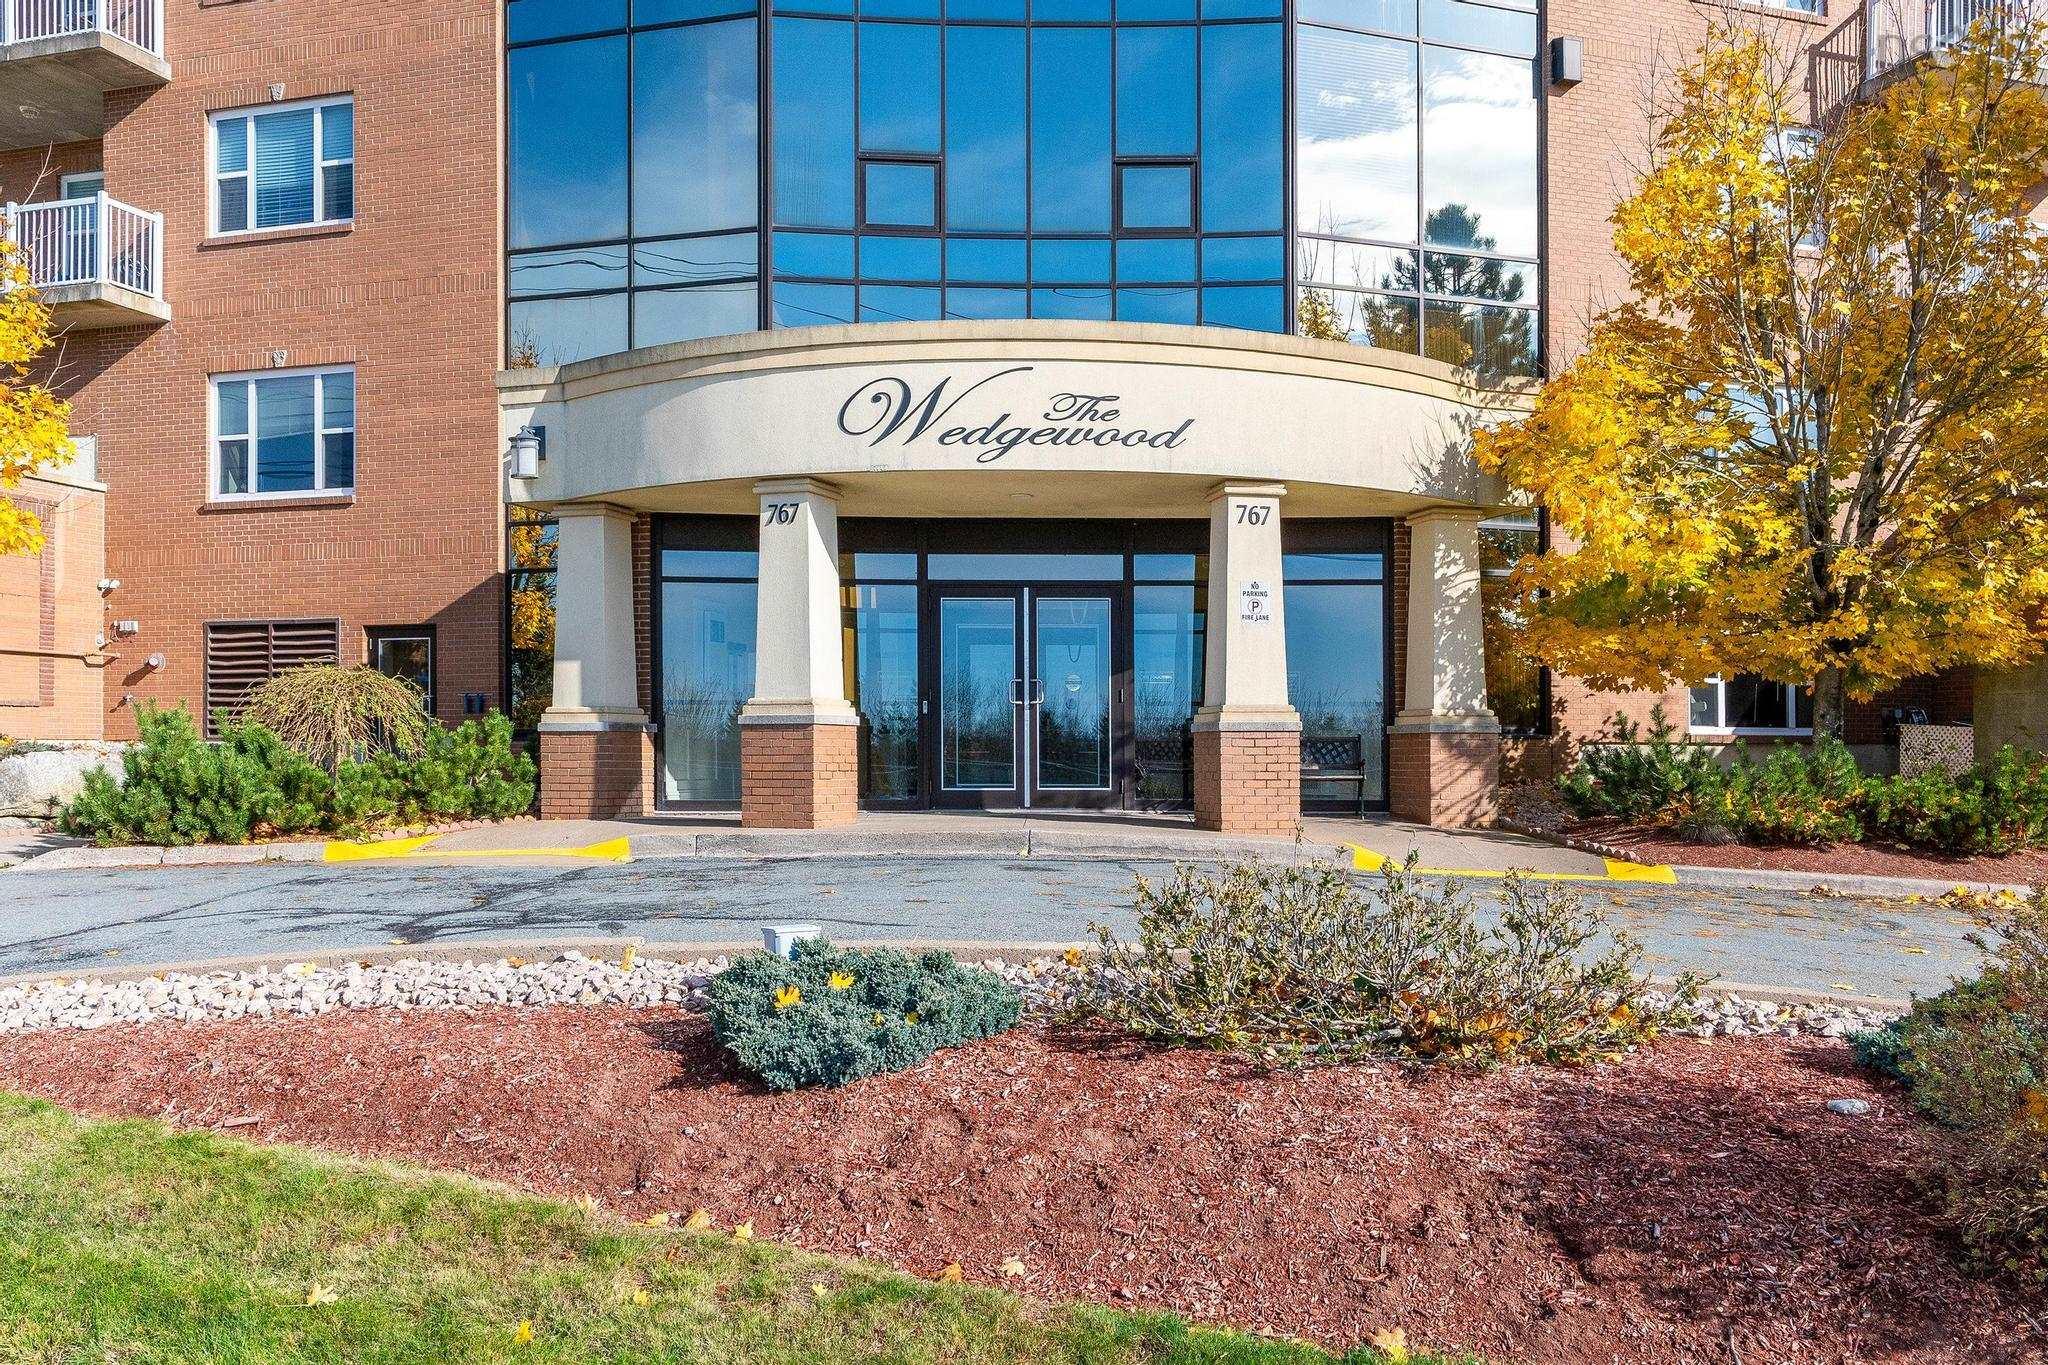
416 767 Parkland Drive, Clayton Park, NS (MLS® 202427452): Welcome to the Wedgwood and one of its most sought after units- A top floor, corner condo with almost 1700 sq ft of living space. This 2 bed + den unit has spacious and sun filled rooms, a large custom kitchen with breakfast bar and roomy living room and dining room with gleaming engineered cherry hard wood floors. Other upgrades include the beautiful wainscotting and cove mouldings. The primary bedroom has a full ensuite and large walk in closet. There is another full bath next to the second bedroom. The unit boasts loads of storage as well as a kitchen pantry. There is also air conditioning for those warm summer evenings when you can sit on the balcony and watch the sunset. The Wedgewood offers great amenities that are included in your fees such as a year round indoor pool, gym, meeting room, guest suite, assigned underground parking library, hot tub, sauna, car wash bay and more. Situated near all amenities in Clayton Park and minutes from Bayer’s lake and Larry Uteck this location is superb. Units like this are rare to find so ensure you put this one on your viewing list.condo fees also include heat, hot water.
Directions to 416 767 Parkland Drive, Clayton Park, NS (MLS® 202427452): Kearney Lake or Dunbrack to Parkland
Listing Courtesy of: Royal LePage Atlantic
Inclusions: Fridge, stove, dishwasher, washer, dryer
Utilities
Rooms
| Level | Type | Dimensions |
|---|---|---|
| Main Floor | Bath 1 | 6.11x9.3 |
| Main Floor | Bath 2 | 12.5x6 |
| Main Floor | Bedroom | 10.10 x11.5 |
| Main Floor | Den/Office | 14.4 x12.5 |
| Main Floor | Dining Room | 13.4 x9.6 |
| Main Floor | Kitchen | 14.6 x11.7 |
| Main Floor | Living Room | 19.11x15.5 |
| Main Floor | Primary Bedroom | 15.10 x15.1 |
| Main Floor | Storage | 6 x10.7 |
Demographics for 416 767 Parkland Drive, Clayton Park, NS (MLS® 202427452)
Census Year: 2016
- Subdivision Name: Halifax
- Population Count: 1,391
- Private Dwellings Count: 567
- Land Area: 0.35 Km2
Similar Listings
 Single Family $499,900
 Welcome to The Wedgewood, where convenience and comfort come together in this fantastic 2-bedr…
 Single Family $500,000
 Welcome to The Tiara Gardens, where comfort and tranquility come together. This beautifully de…
 Single Family $629,900
 Welcome to 49 Flamingo Drive, a lovingly maintained home that has been cared for by one family…
 Single Family $489,900
 Charming Semi-Detached Home in Rockingham – 219 Melody Drive Welcome to 219 Melody Drive, a be…