23 Ropewalk Lane, Dartmouth, NS (MLS® 202508446) Single Family For Sale

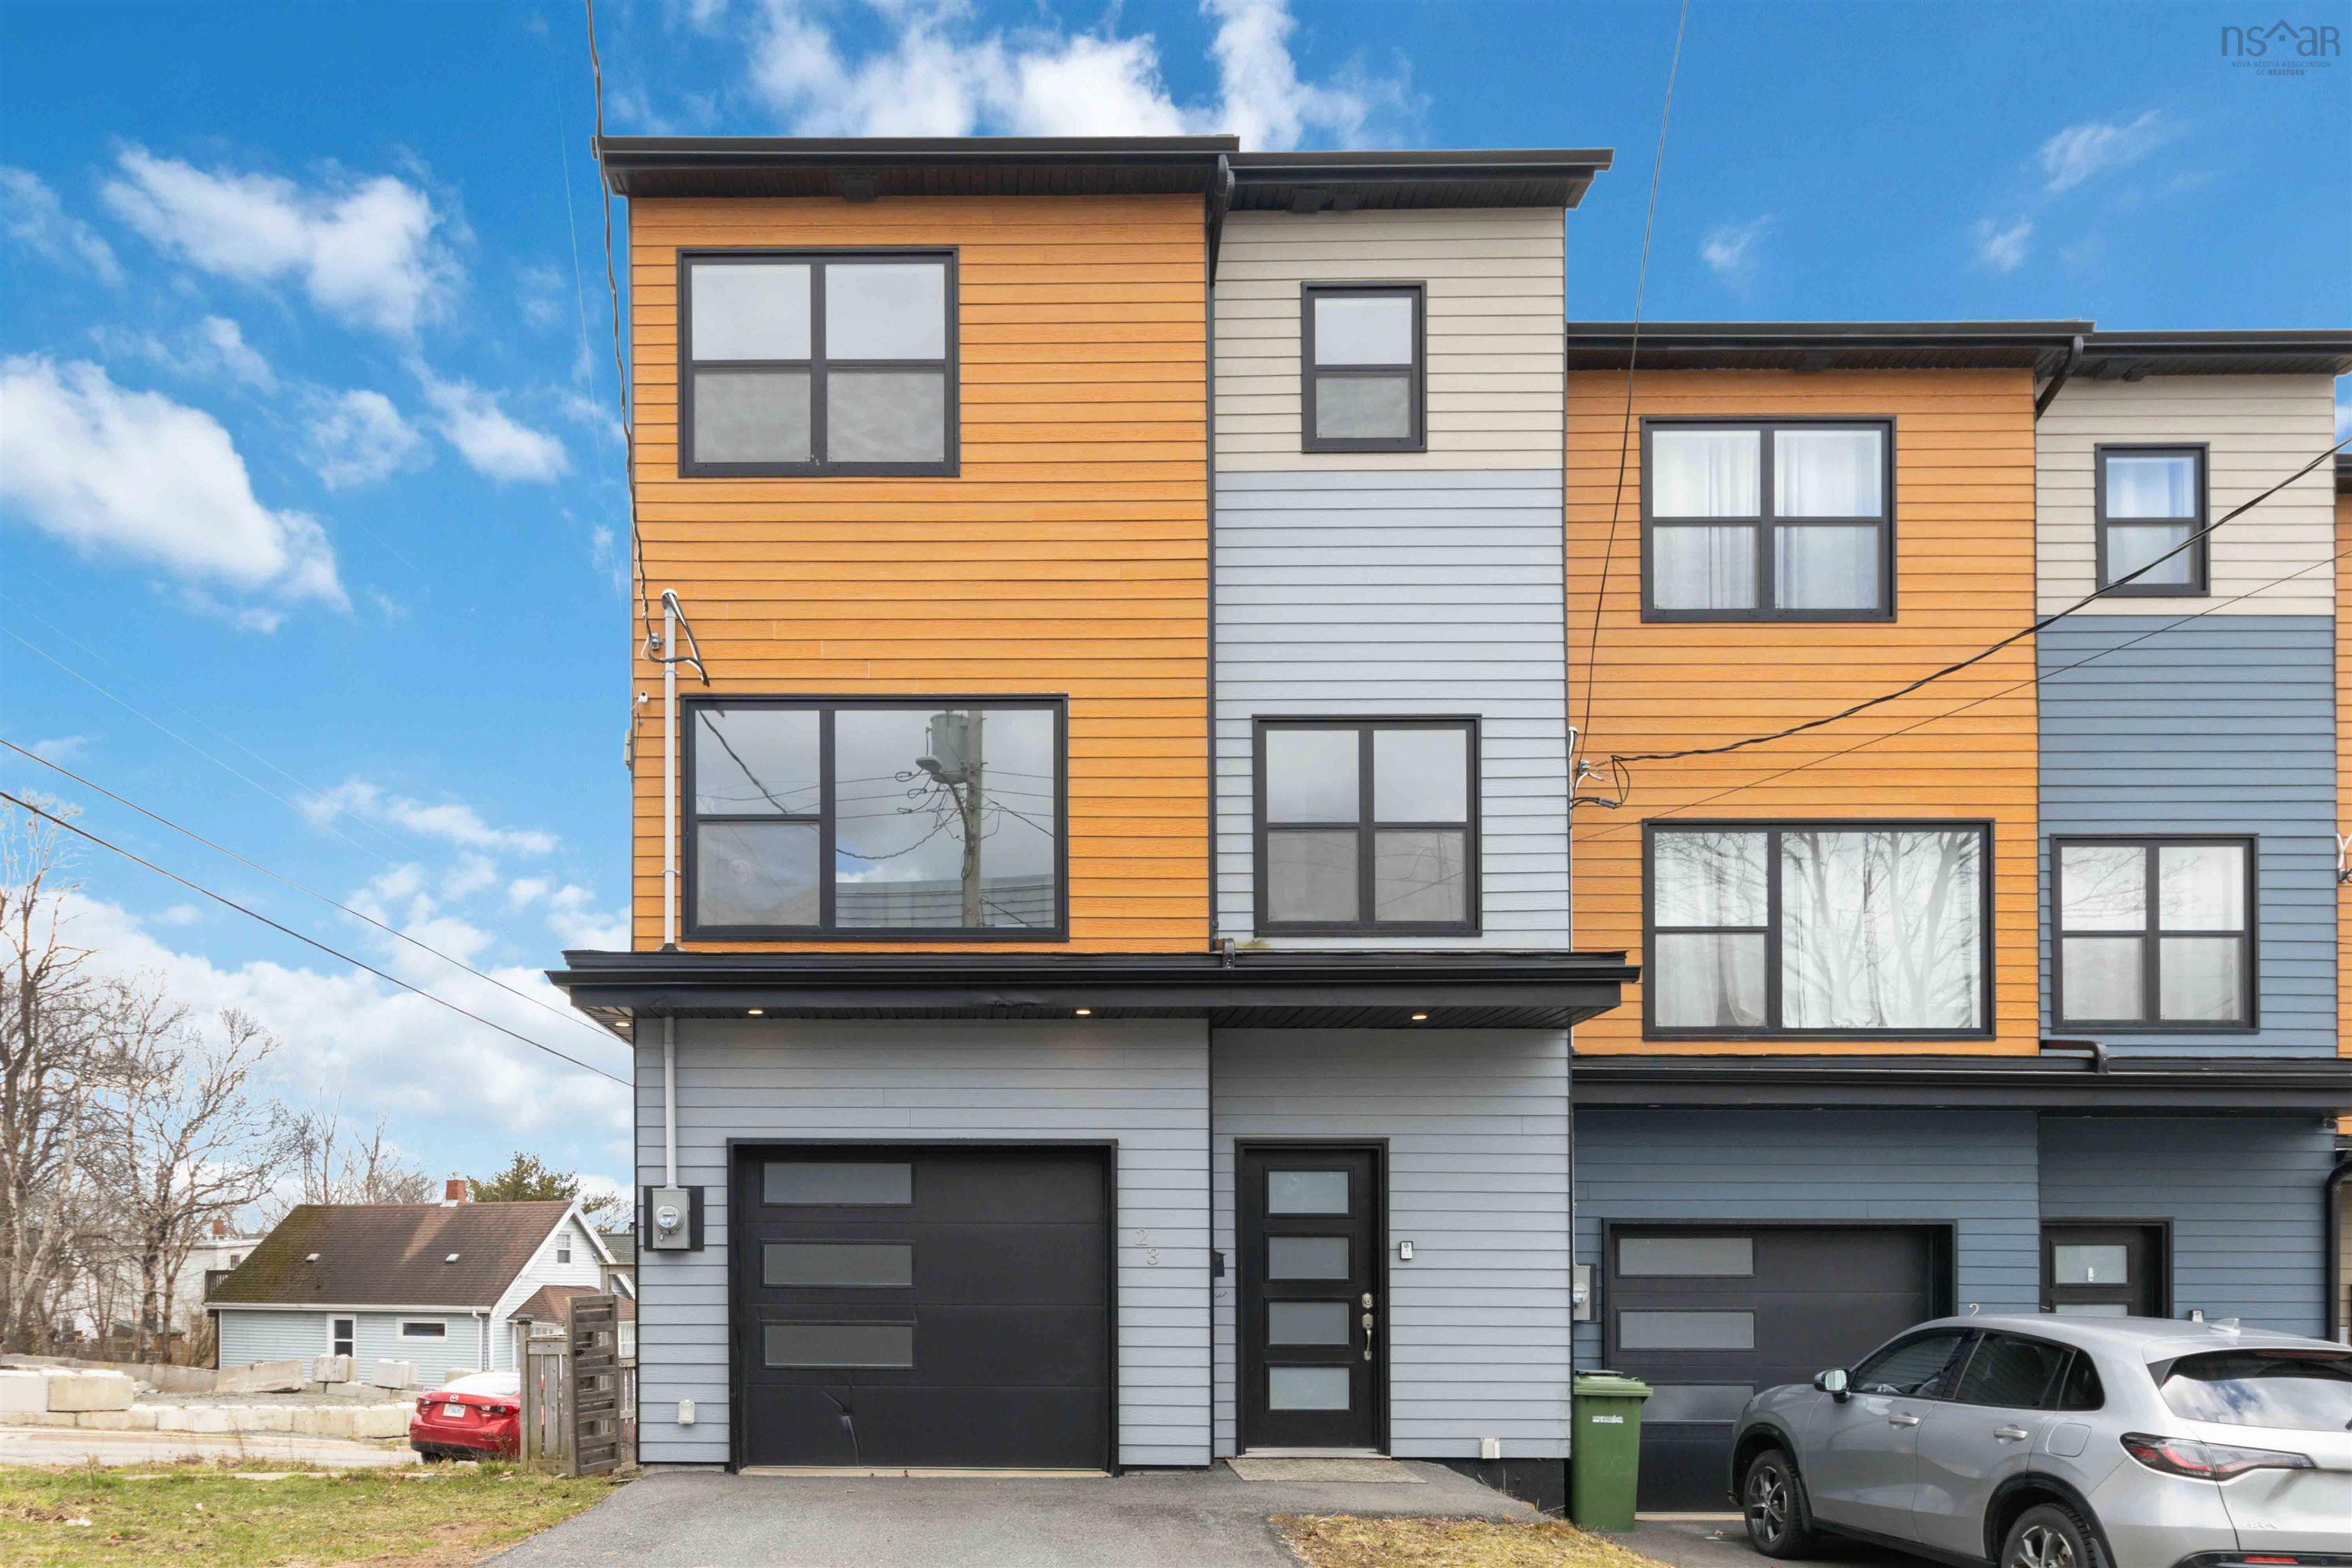
23 Ropewalk Lane, Dartmouth, NS, B3A 0E6
MLS® # 202508446


$549,900

23 Ropewalk Lane, Dartmouth, NS (MLS® 202508446): This modern 6-year-old end-unit townhome offers a fantastic layout with 3 bedrooms, 4 bathrooms, and an attached garage. The kitchen opens to the dining area and features lovely views of the Halifax Harbour. The spacious primary suite includes a walk-in closet and a private ensuite. Ideally located just a short walk to downtown Dartmouth, grocery stores, cafes, and more. Conveniently on a bus route and only 15 minutes to downtown Halifax, local universities, and the NSCC campus.

Directions to 23 Ropewalk Lane, Dartmouth, NS (MLS® 202508446): Wyse Road to Jamieson to Ropewalk.

Listing Courtesy of: Keller Williams Select Realty

Inclusions: Fridge, brand new stove, dishwasher, washer, dryer.

Utilities

Features

Community Features

Rooms

LevelTypeDimensions
Main FloorBath 16x6.3
Main FloorDining Roomcombined with kitchen
Main FloorKitchen17 x 15.3
Main FloorLiving Room18.11 x 12
LevelTypeDimensions
3rd LevelBath 2804x5.7
3rd LevelBedroom11 x 9.11
3rd LevelEnsuite Bath 28.3 x 7.7
3rd LevelPrimary Bedroom13.6 x 12
LevelTypeDimensions
Lower LevelBedroom10.6 x 10.5
Lower LevelEnsuite Bath 16.4 x 6.10
Lower LevelFoyer7 x7

Virtual Tours of 23 Ropewalk Lane, Dartmouth, NS (MLS® 202508446)


Schools

TypeName
Elementary SchoolHarbour View Elementary School
Middle SchoolJohn Martin Junior High School
High SchoolJohn Martin Junior High School
Elementary School (Fr. Imm.)Shannon Park Elementary School
Middle School (Fr. Imm.)Dartmouth South Academy
High School (Fr. Imm.)Dartmouth High School

Demographics for 23 Ropewalk Lane, Dartmouth, NS (MLS® 202508446)

Census Year: 2016

12090203
  • Subdivision Name: Halifax
  • Population Count: 335
  • Private Dwellings Count: 176
  • Land Area: 0.16 Km2
100+100+95 - 9995 - 9990 - 9490 - 9485 - 8985 - 8980 - 8480 - 8475 - 7975 - 7970 - 7470 - 7465 - 6965 - 6960 - 6460 - 6455 - 5955 - 5950 - 5450 - 5445 - 4945 - 4940 - 4440 - 4435 - 3935 - 3930 - 3430 - 3425 - 2925 - 2920 - 2420 - 2415 - 1915 - 1910 - 1410 - 145 - 95 - 90 - 40 - 4Age Group8%8%6%6%4%4%2%2%0%0%2%2%4%4%6%6%8%8%Percent2016 Population Age Pyramid (Dissimination Area: 12090203)
Males
Females
Download SVG
Download PNG
Download CSV
47.8%52.2%2016 Population Gender Distribution (Dissimination Area: 12090203)
Males
Females
MarriedLiving Common LawMarried or Living Common LawNever marriedSeparatedDivorcedWidowedSingle2016 Population Marital Status (Dissimination Area: 12090203)
Married or Living Common Law
Single
Download SVG
Download PNG
Download CSV
No certificate, diploma or degree: 35Secondary (high) school diploma or equivalency certificate: 125Apprenticeship or trades certificate or diploma: 15College, CEGEP or other non-university certificate or diploma: 45University certificate or diploma below bachelor level: 10University certificate, diploma or degree at bachelor level or above: 751401401201201001008080606040402020002016 Population Highest Certificate, Diploma or DegreePopulation Aged 15+ (25% Sample Data)
Download SVG
Download PNG
Download CSV
ManagementManagementBusinessBusinessNatural/Applied Scie...Natural/Applied ScienceHealth SectorHealth SectorEducation/Law/Gove...Education/Law/GovernmentArt/Culture/RecreationArt/Culture/RecreationSales/ServiceSales/ServiceTrades/TransportTrades/TransportNatural Resources/Agr...Natural Resources/AgricultureManufacturing/UtilitiesManufacturing/Utilities7070606050504040303020201010002016 Population Labour ForcePopulation Aged 15+ (25% Sample Data)
Download SVG
Download PNG
Download CSV
Under $5KUnder $5K$5K - $10K$5K - $10K$10K - $15K$10K - $15K$15K - $20K$15K - $20K$20K - $25K$20K - $25K$25K - $30K$25K - $30K$30K - $35K$30K - $35K$35K - $40K$35K - $40K$40K - $45K$40K - $45K$45K - $50K$45K - $50K$50K - $60K$50K - $60K$60K - $70K$60K - $70K$70K - $80K$70K - $80K$80K - $90K$80K - $90K$90K - $100K$90K - $100K$100K - $125K$100K - $125K$125K - $150K$125K - $150K$150K - $200K$150K - $200KOver $200KOver $200K20201818161614141212101088664422002016 Household Income Groups
Download SVG
Download PNG
Download CSV
34.4%65.6%Rent vs. OwnTenure (25% Sample Data)
Rent
Own
Before 1960Before 19601961 - 19801961 - 19801981 - 19901981 - 19901991 - 20001991 - 20002001 - 20052001 - 20052006 - 20102006 - 20102011 - 20162011 - 2016160160140140120120100100808060604040202000Swellings Construction Period(25% Sample Data)
Download SVG
Download PNG
Download CSV