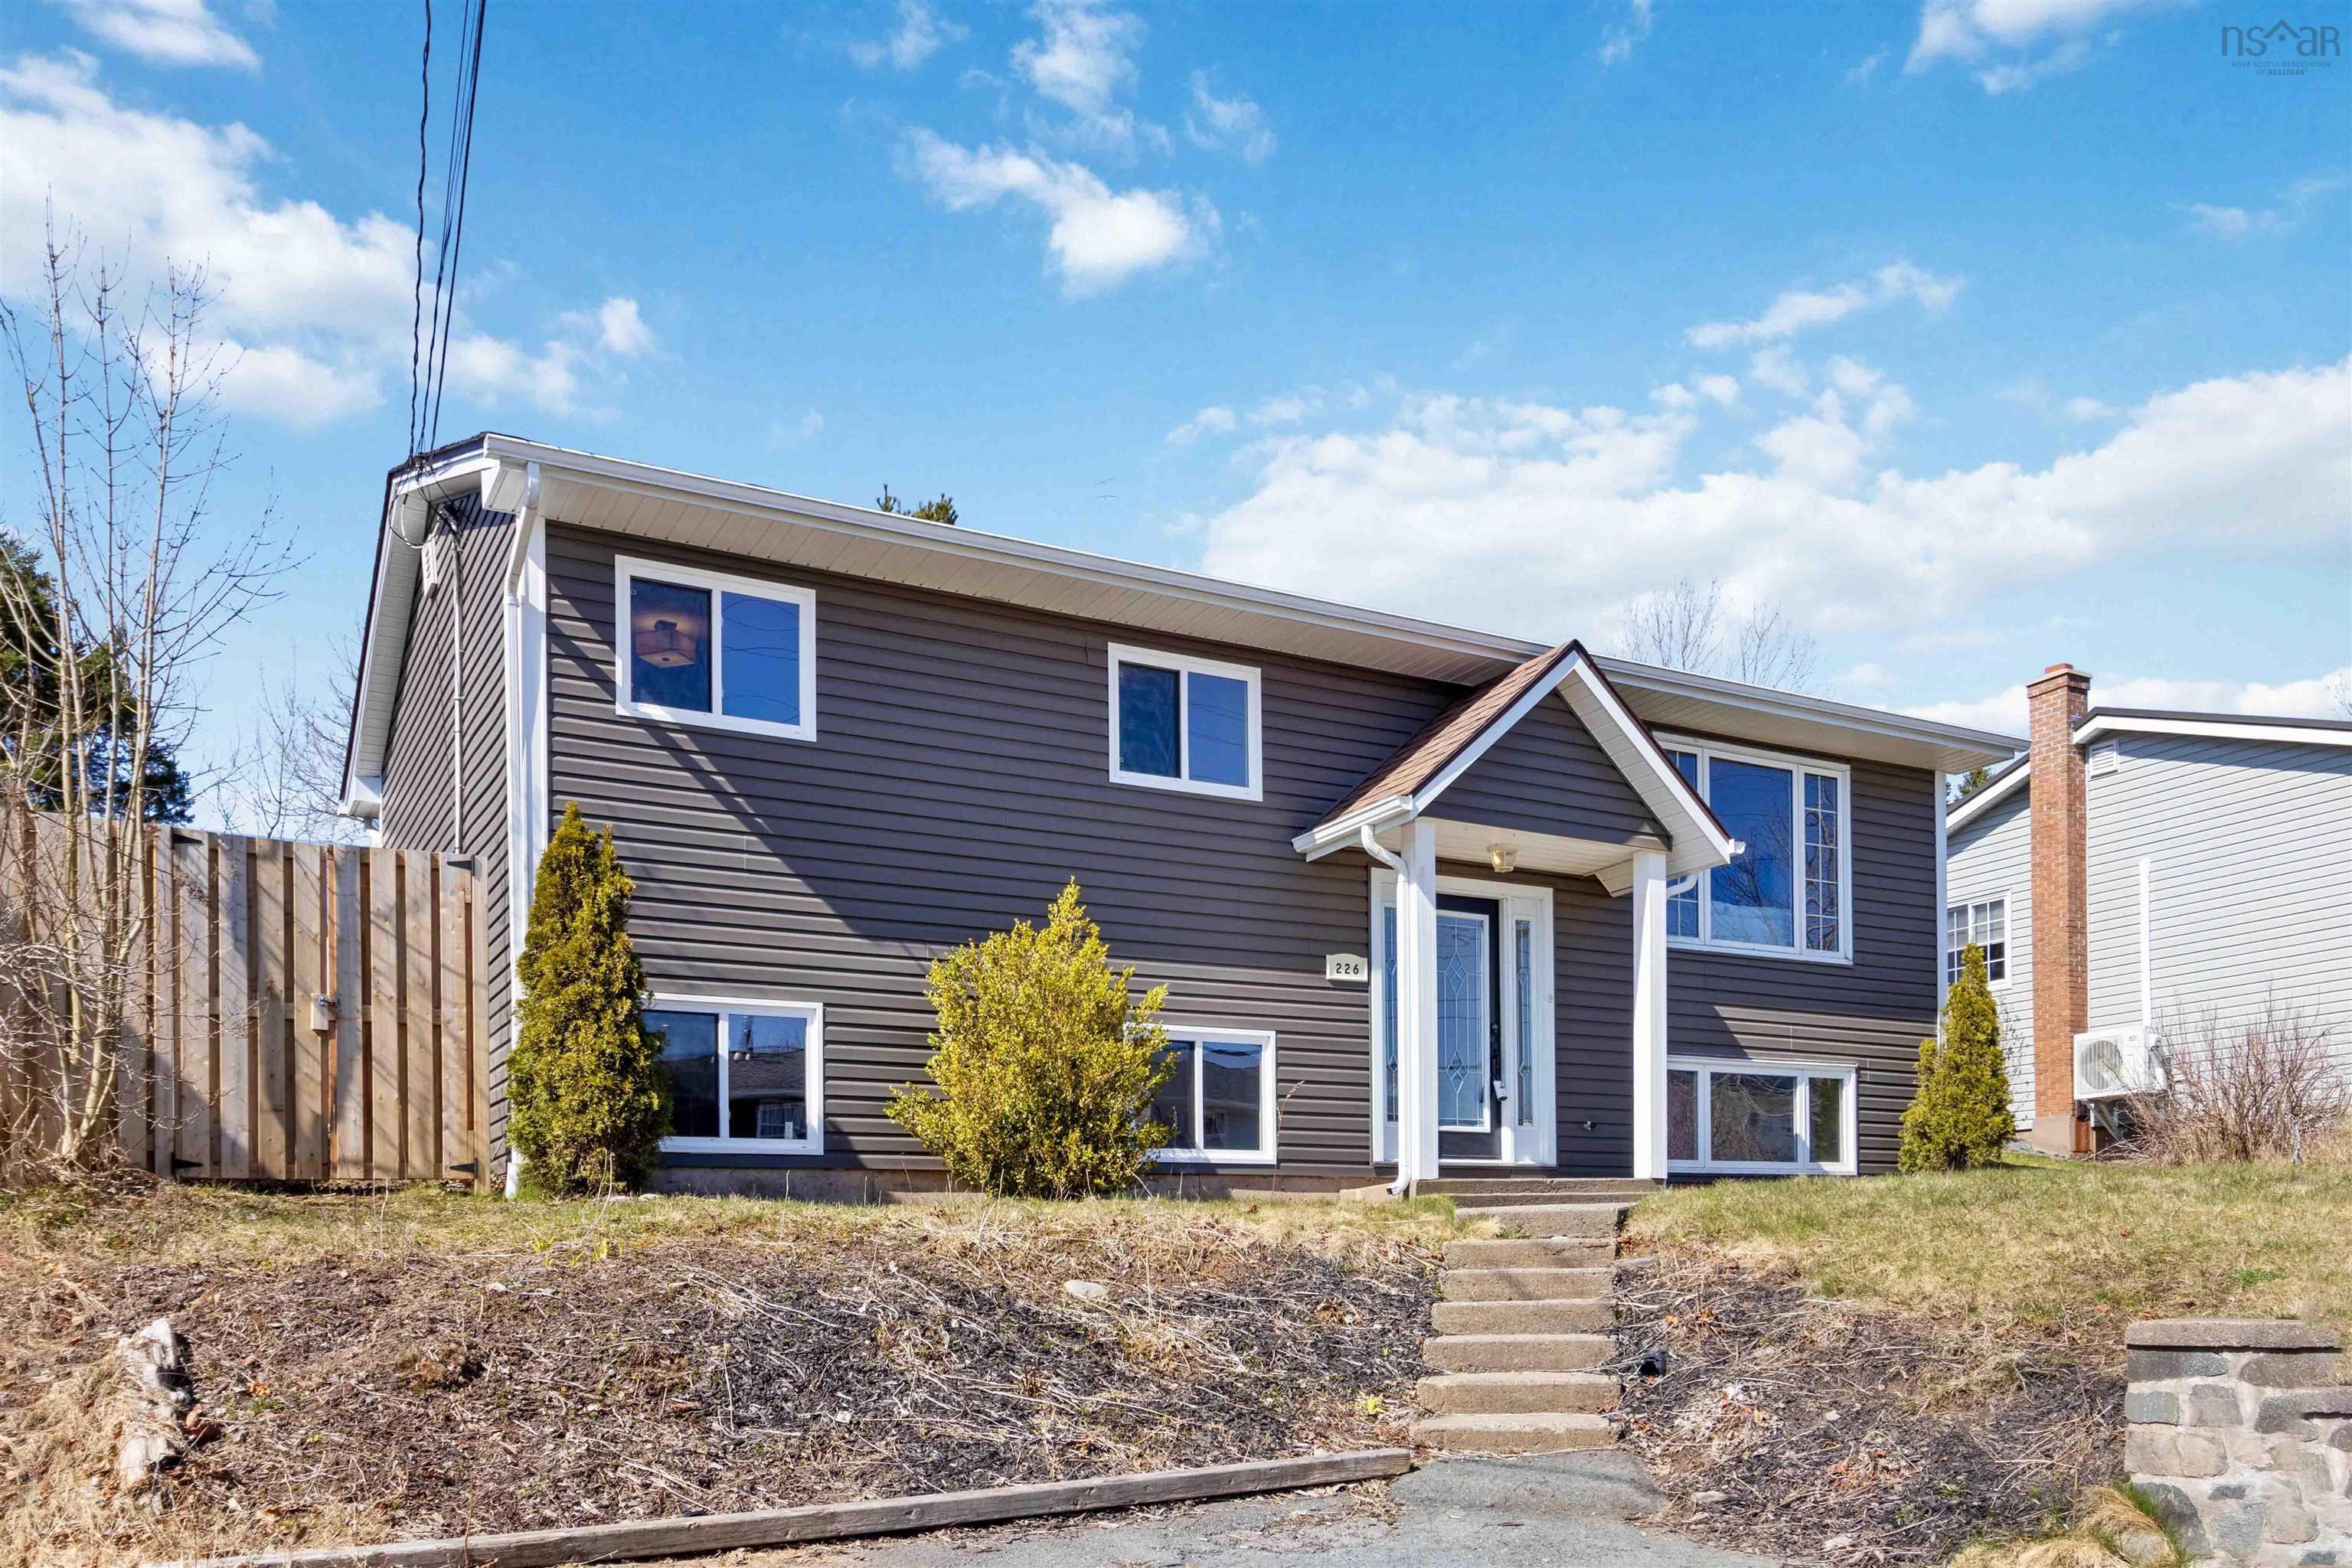
226 Poplar Drive, Cole Harbour, NS (MLS® 202508757)
 Single Family For Sale
 226 Poplar Drive, Cole Harbour, NS, B2W 4W5
MLS® # 202508757
$515,000
226 Poplar Drive, Cole Harbour, NS (MLS® 202508757): Welcome to 226 Poplar Drive—a move-in ready, open-concept cozy 4-bedroom, 2-bathroom home perfectly situated just 10 minutes from Rainbow Haven Beach and Mic Mac Mall. Surrounded by beautiful walking trails, this home offers both convenience and natural beauty right at your doorstep. Inside, you'll find a spacious and modern layout with stainless steel appliances, ideal for families or entertaining, while the fully fenced backyard provides a private outdoor retreat. With plenty of updates and a layout designed for comfortable living, this property is the perfect blend of lifestyle and location.
Directions to 226 Poplar Drive, Cole Harbour, NS (MLS® 202508757): Cole Harbour Road to Main Street to Poplar Drive
Listing Courtesy of: RE/MAX Nova
Inclusions: Fridge, Stove, Microwave, Dishwasher, Washer, Dryer.
Utilities
Community Features
Rooms
| Level | Type | Dimensions |
|---|---|---|
| Main Floor | Bath 1 | 4 pc |
| Main Floor | Bedroom | 11'2X9'1 |
| Main Floor | Bedroom | 7'10X13 |
| Main Floor | Bedroom | 7'11X9'7 |
| Main Floor | Dining Room | 9'7X9'3 |
| Main Floor | Kitchen | 10'11X9 |
| Main Floor | Living Room | 13'9X13'2 |
| Level | Type | Dimensions |
|---|---|---|
| Lower Level | Bath 2 | + Laundry |
| Lower Level | Bedroom | 12'9X11'3 |
| Lower Level | Rec Room | 17'6X21'4 |
Schools
| Type | Name |
|---|---|
| Elementary School | Robert Kemp Turner Elementary School |
| Middle School | Sir Robert Borden Junior High School |
| High School | Sir Robert Borden Junior High School |
| Middle School (Fr. Imm.) | Sir Robert Borden Junior High School |
| High School (Fr. Imm.) | Cole Harbour District High School |
Demographics for 226 Poplar Drive, Cole Harbour, NS (MLS® 202508757)
Census Year: 2016
- Subdivision Name: Halifax
- Population Count: 526
- Private Dwellings Count: 204
- Land Area: 0.17 Km2
Similar Listings
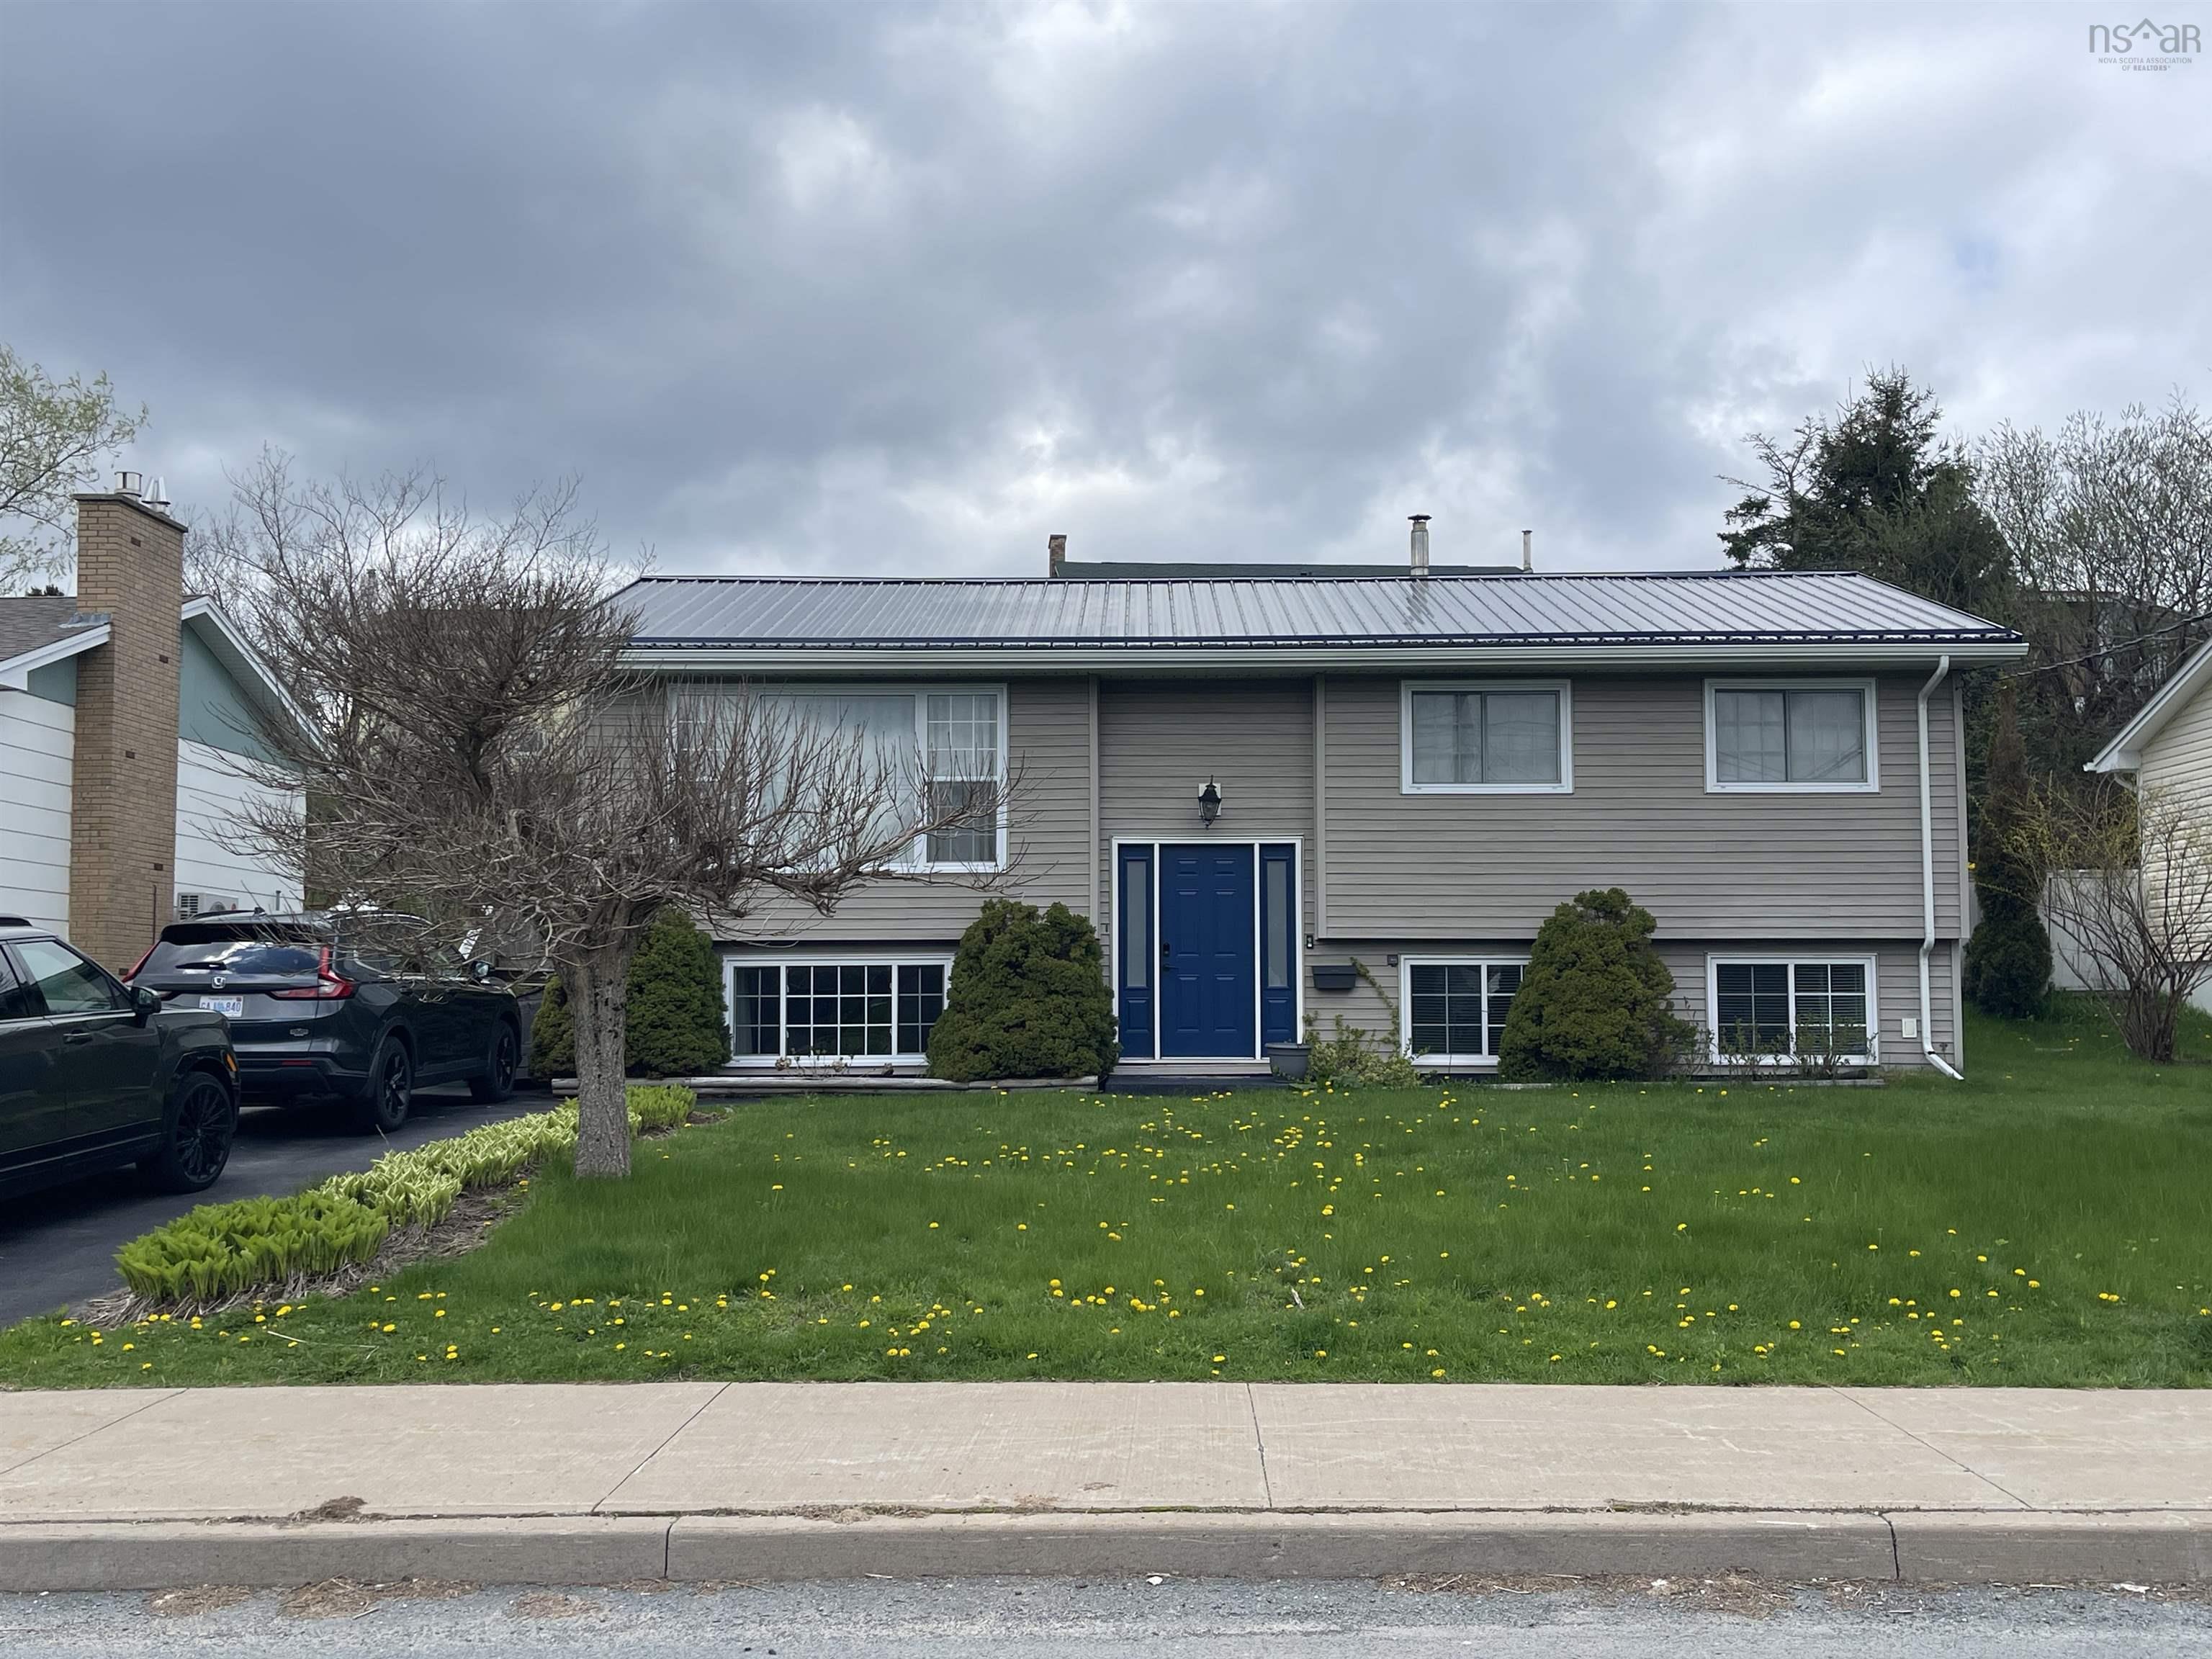 Single Family $524,900
 This beautifully maintained 4-bedroom, 2-bath split-entry home has been thoughtfully updated t…
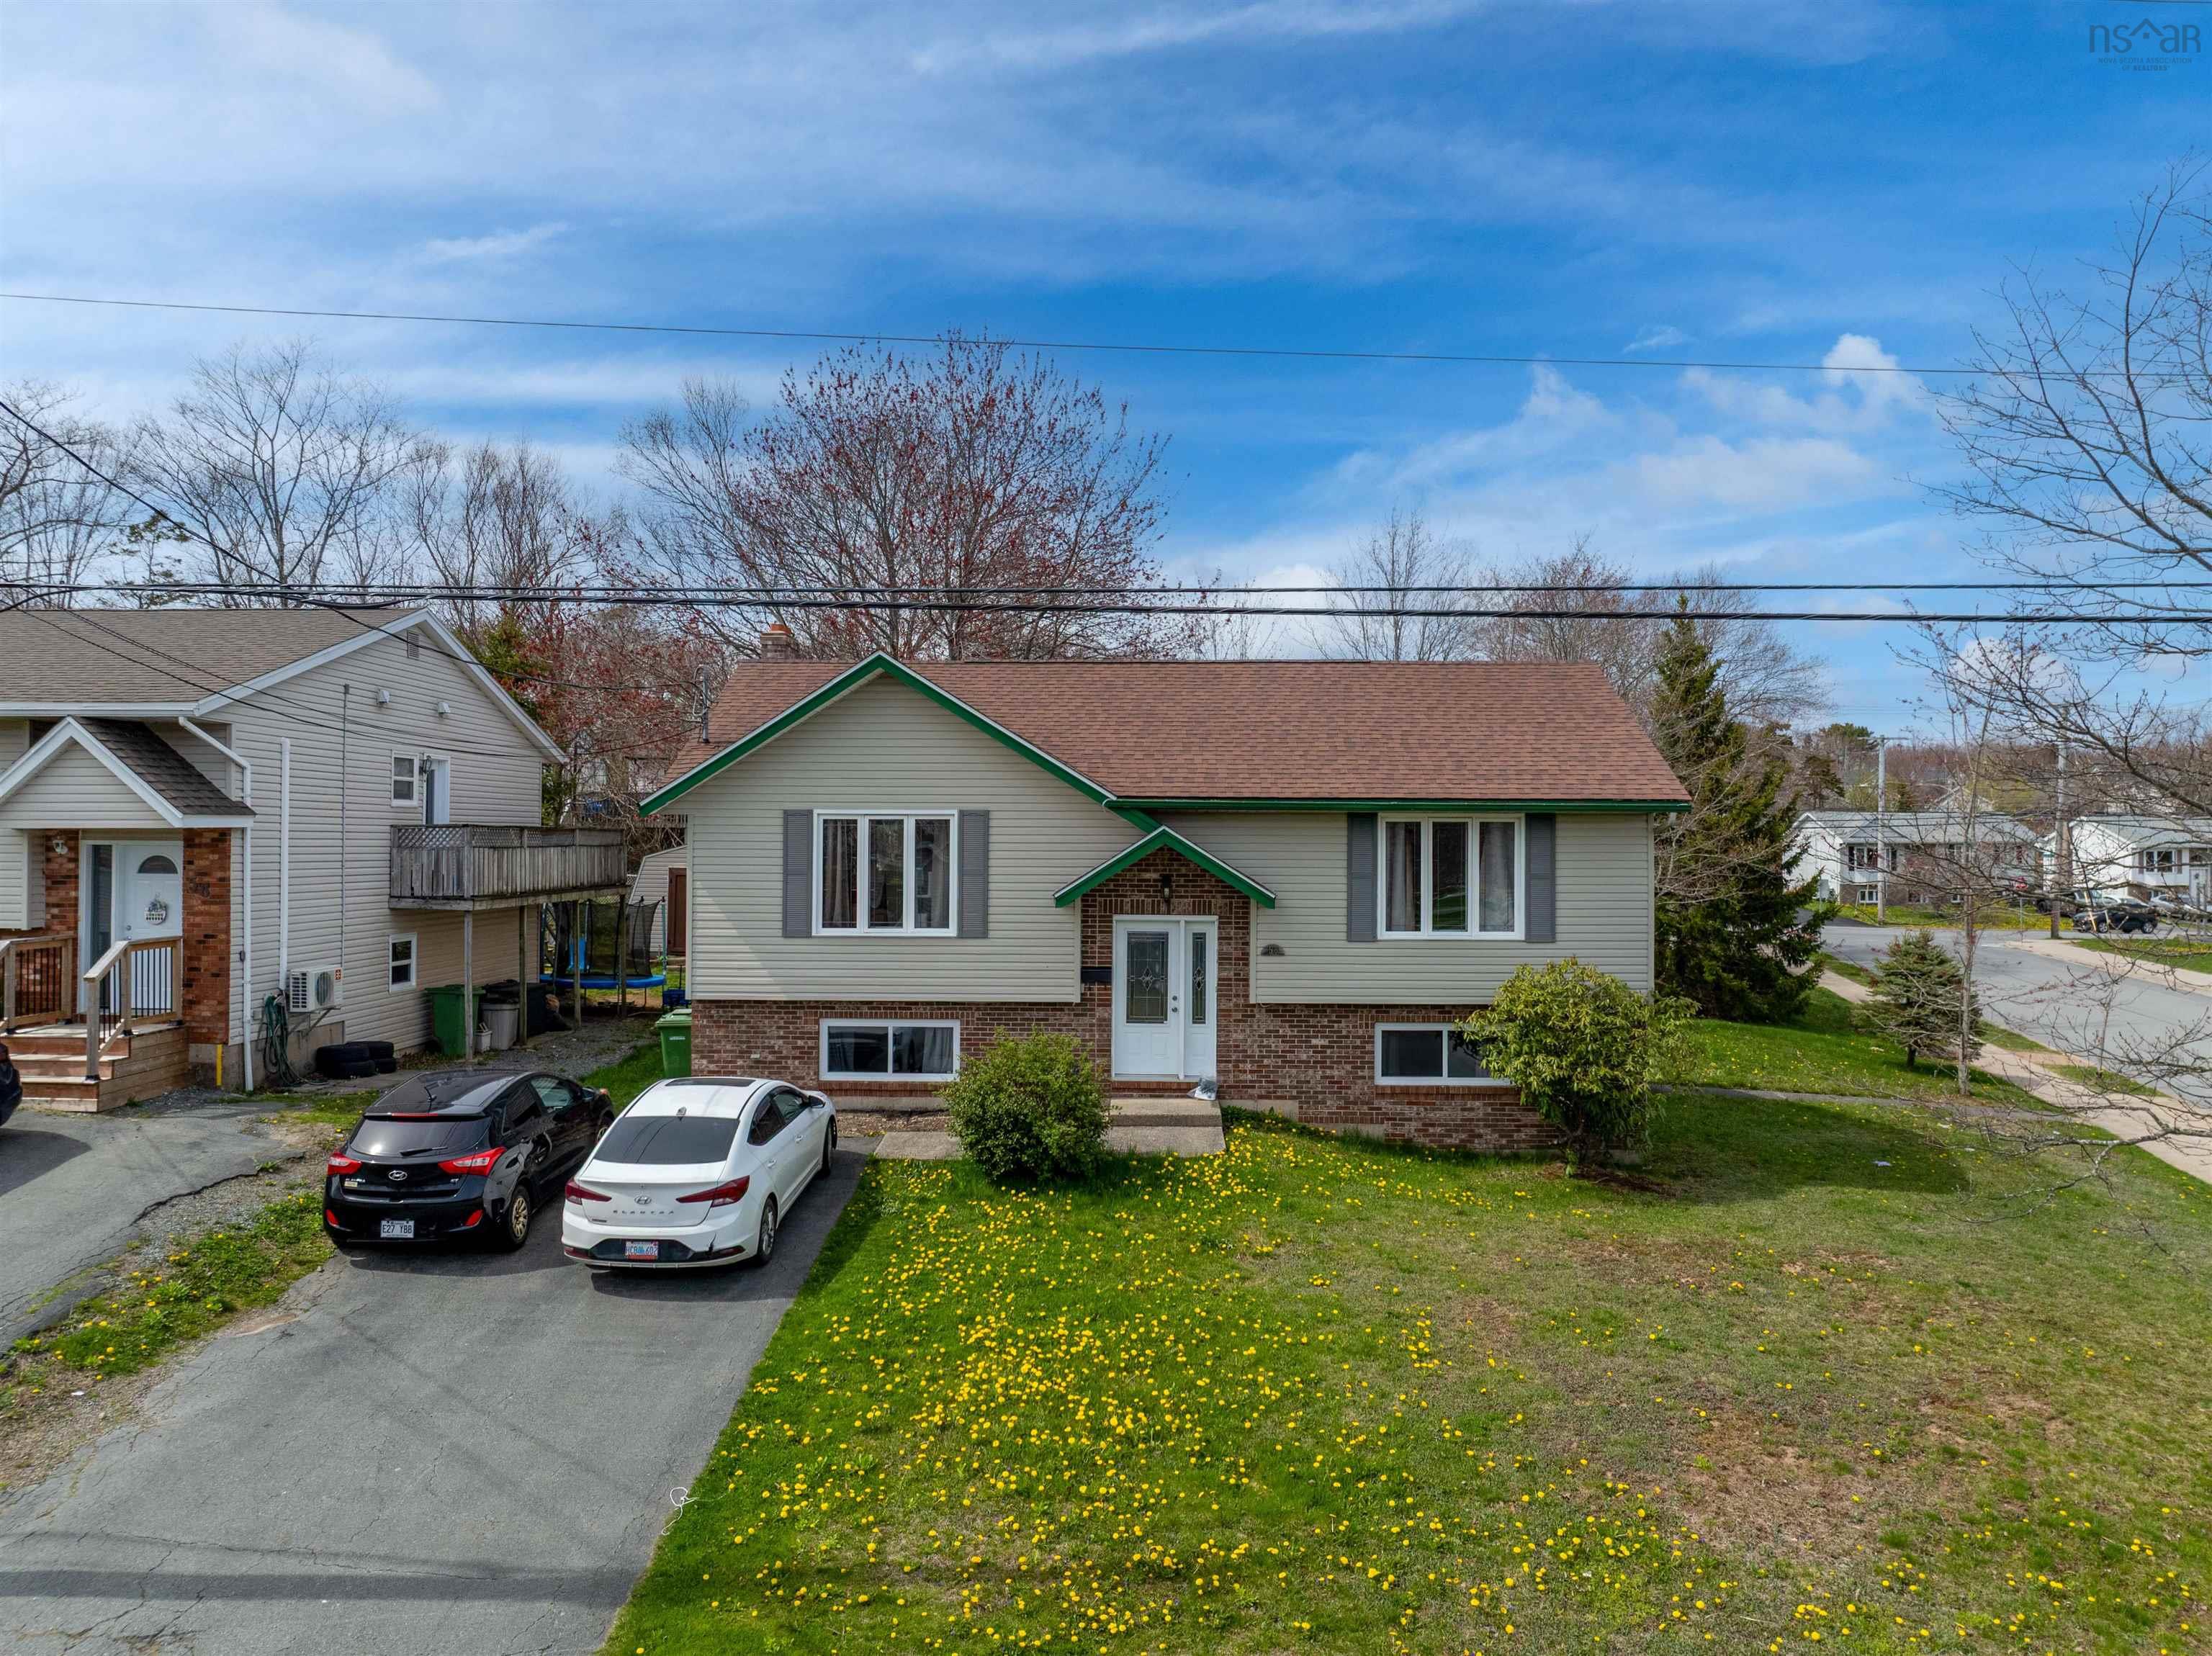
 Single Family $529,900
 Welcome to this charming and spacious 4-bedroom, 2-bathroom bungalow, perfectly situated on a …
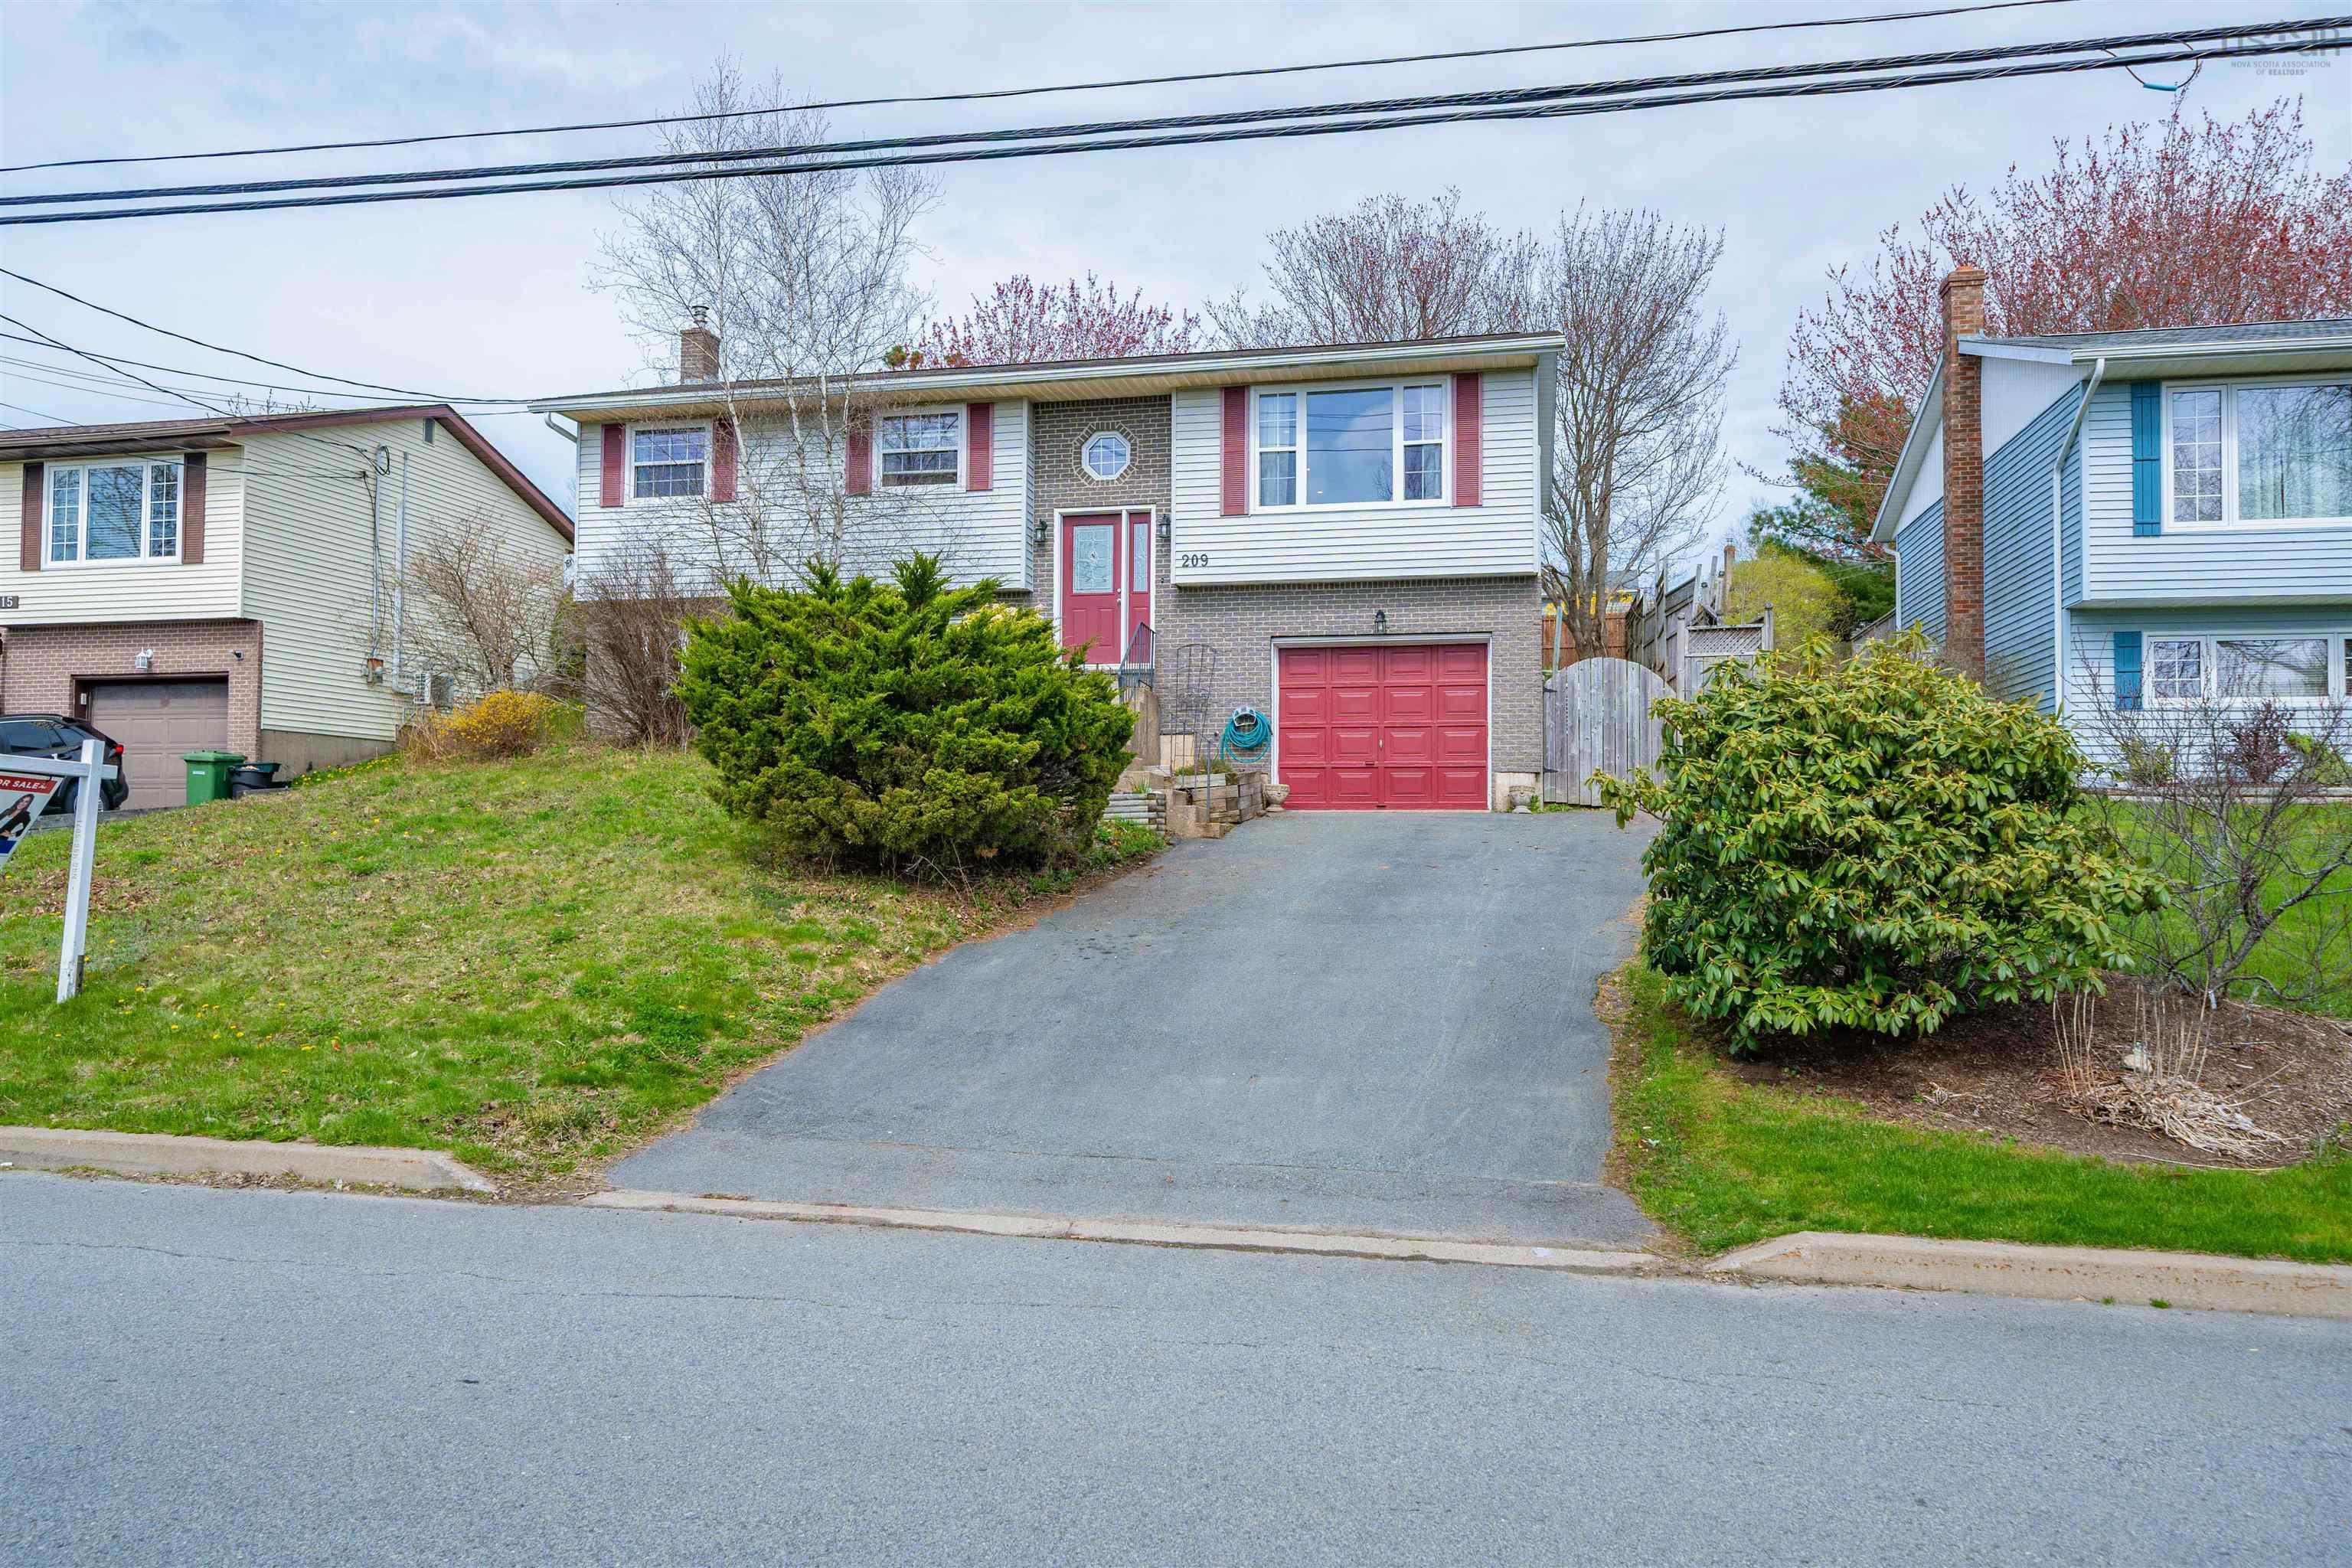
 Single Family $499,000
 Welcome to 58 Sophia Crescent! This lovely 4-bedroom, 1.5-bath split-entry home sits on a spac…
 Single Family $475,000
 This warm and inviting 3-bedroom, 2.5-bath split entry home is full of charm! The main level f…