171 Carnoustie Drive, Hammonds Plains, NS (MLS® 202423622)
 Single Family For Sale
 171 Carnoustie Drive, Hammonds Plains, NS, B4B 0E5
MLS® # 202423622
$799,900
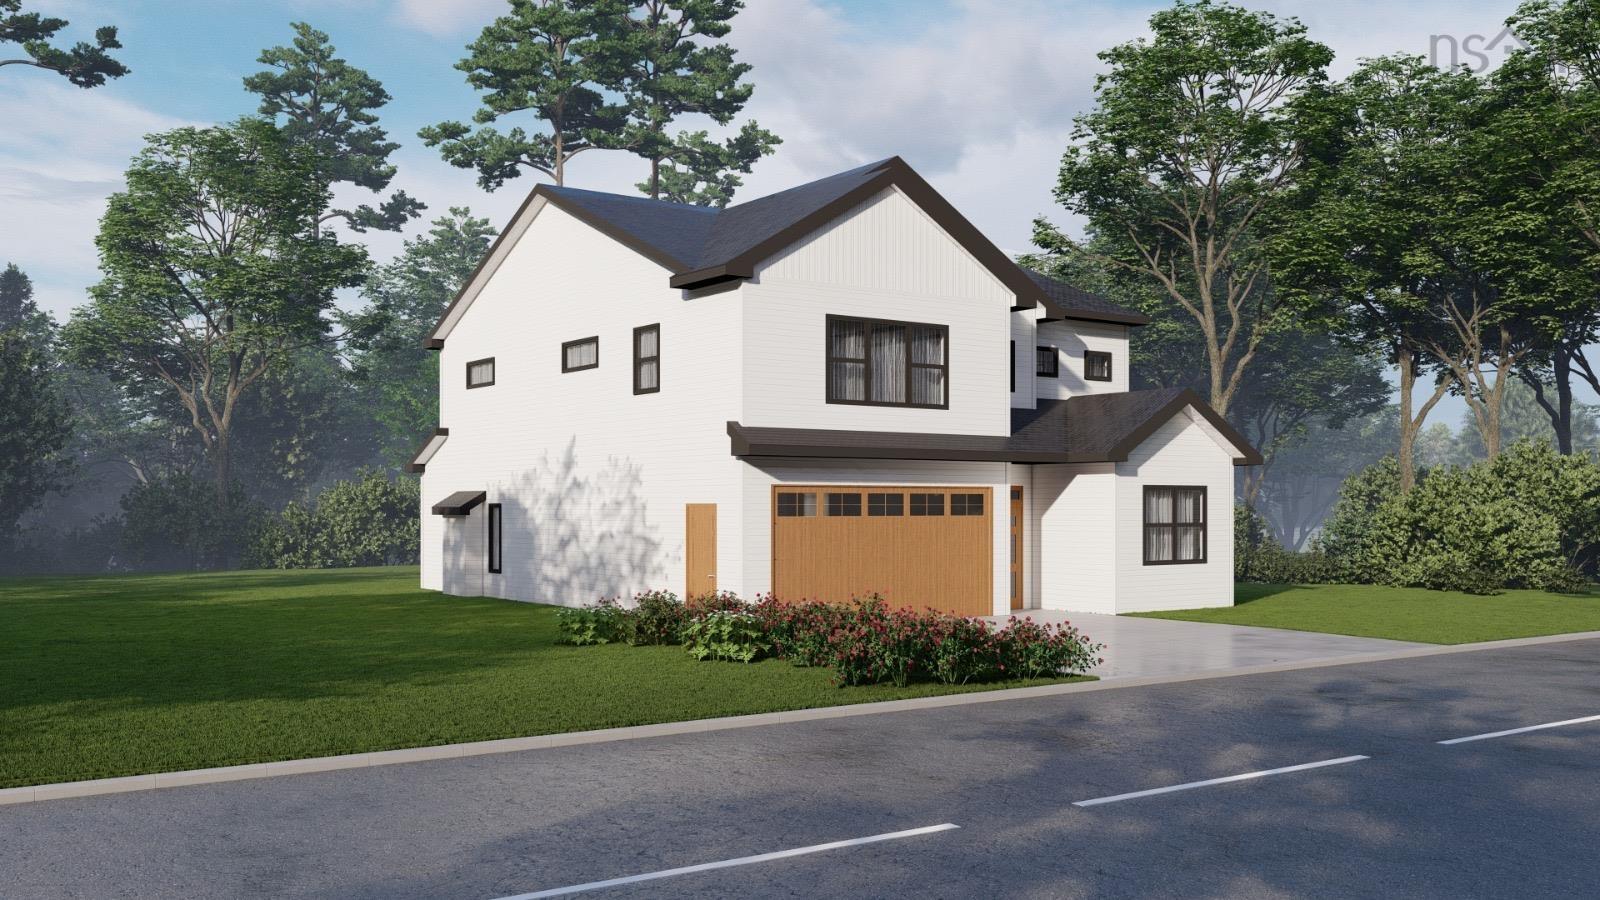
171 Carnoustie Drive, Hammonds Plains, NS (MLS® 202423622): Welcome to the Knolls of Glenn Arbour! This stunning new construction bungalow features 4 bedrooms, 3.5 bathroom and 2,970 sq ft of living space. Enjoy the comfort of being able to enter your home from your attached double car garage during those colder months leading right into your mudroom/laundry room. The main level features an open concept floor plan with a sleek kitchen that features high-end finishes. The kitchen overlooks the well sized living room and dining area. Take in and enjoy the serenity of your private backyard from your spacious balcony. The fully finished walkout basement is where you'll find two bedroom and a spacious rec room that has a rough in for bar.
Directions to 171 Carnoustie Drive, Hammonds Plains, NS (MLS® 202423622): Hammonds Plains Road to Glen Arbour Way, right on Thompson Run, Right on Sandy Run, left on Ballybunion Run to Carnoustie Drive.
Listing Courtesy of: RE/MAX Nova (Halifax)
Utilities
Features
Community Features
Rooms
| Level | Type | Dimensions |
|---|---|---|
| Main Floor | Bath 1 | 5.4 x 5.9 |
| Main Floor | Bedroom | 12.1 x 10.7 |
| Main Floor | Dining Nook | 13 x 7 |
| Main Floor | Ensuite Bath 1 | 5.2 x 9.8 |
| Main Floor | Ensuite Bath 2 | 5.2 x 9.8 |
| Main Floor | Kitchen | 9 x 12.6 |
| Main Floor | Living Room | 20 x 11.6 |
| Main Floor | Mud Room | 9 x 6 |
| Main Floor | Primary Bedroom | 14.5 x 13.7 |
| Level | Type | Dimensions |
|---|---|---|
| Lower Level | Bath 2 | 6.3 x 5.5 |
| Lower Level | Bedroom | 11.4 x 14.7 |
| Lower Level | Rec Room | 19.3 x 19.10 |
Demographics for 171 Carnoustie Drive, Hammonds Plains, NS (MLS® 202423622)
Census Year: 2016
- Subdivision Name: Halifax
- Population Count: 981
- Private Dwellings Count: 350
- Land Area: 7.75 Km2
Similar Listings
 Single Family $859,900
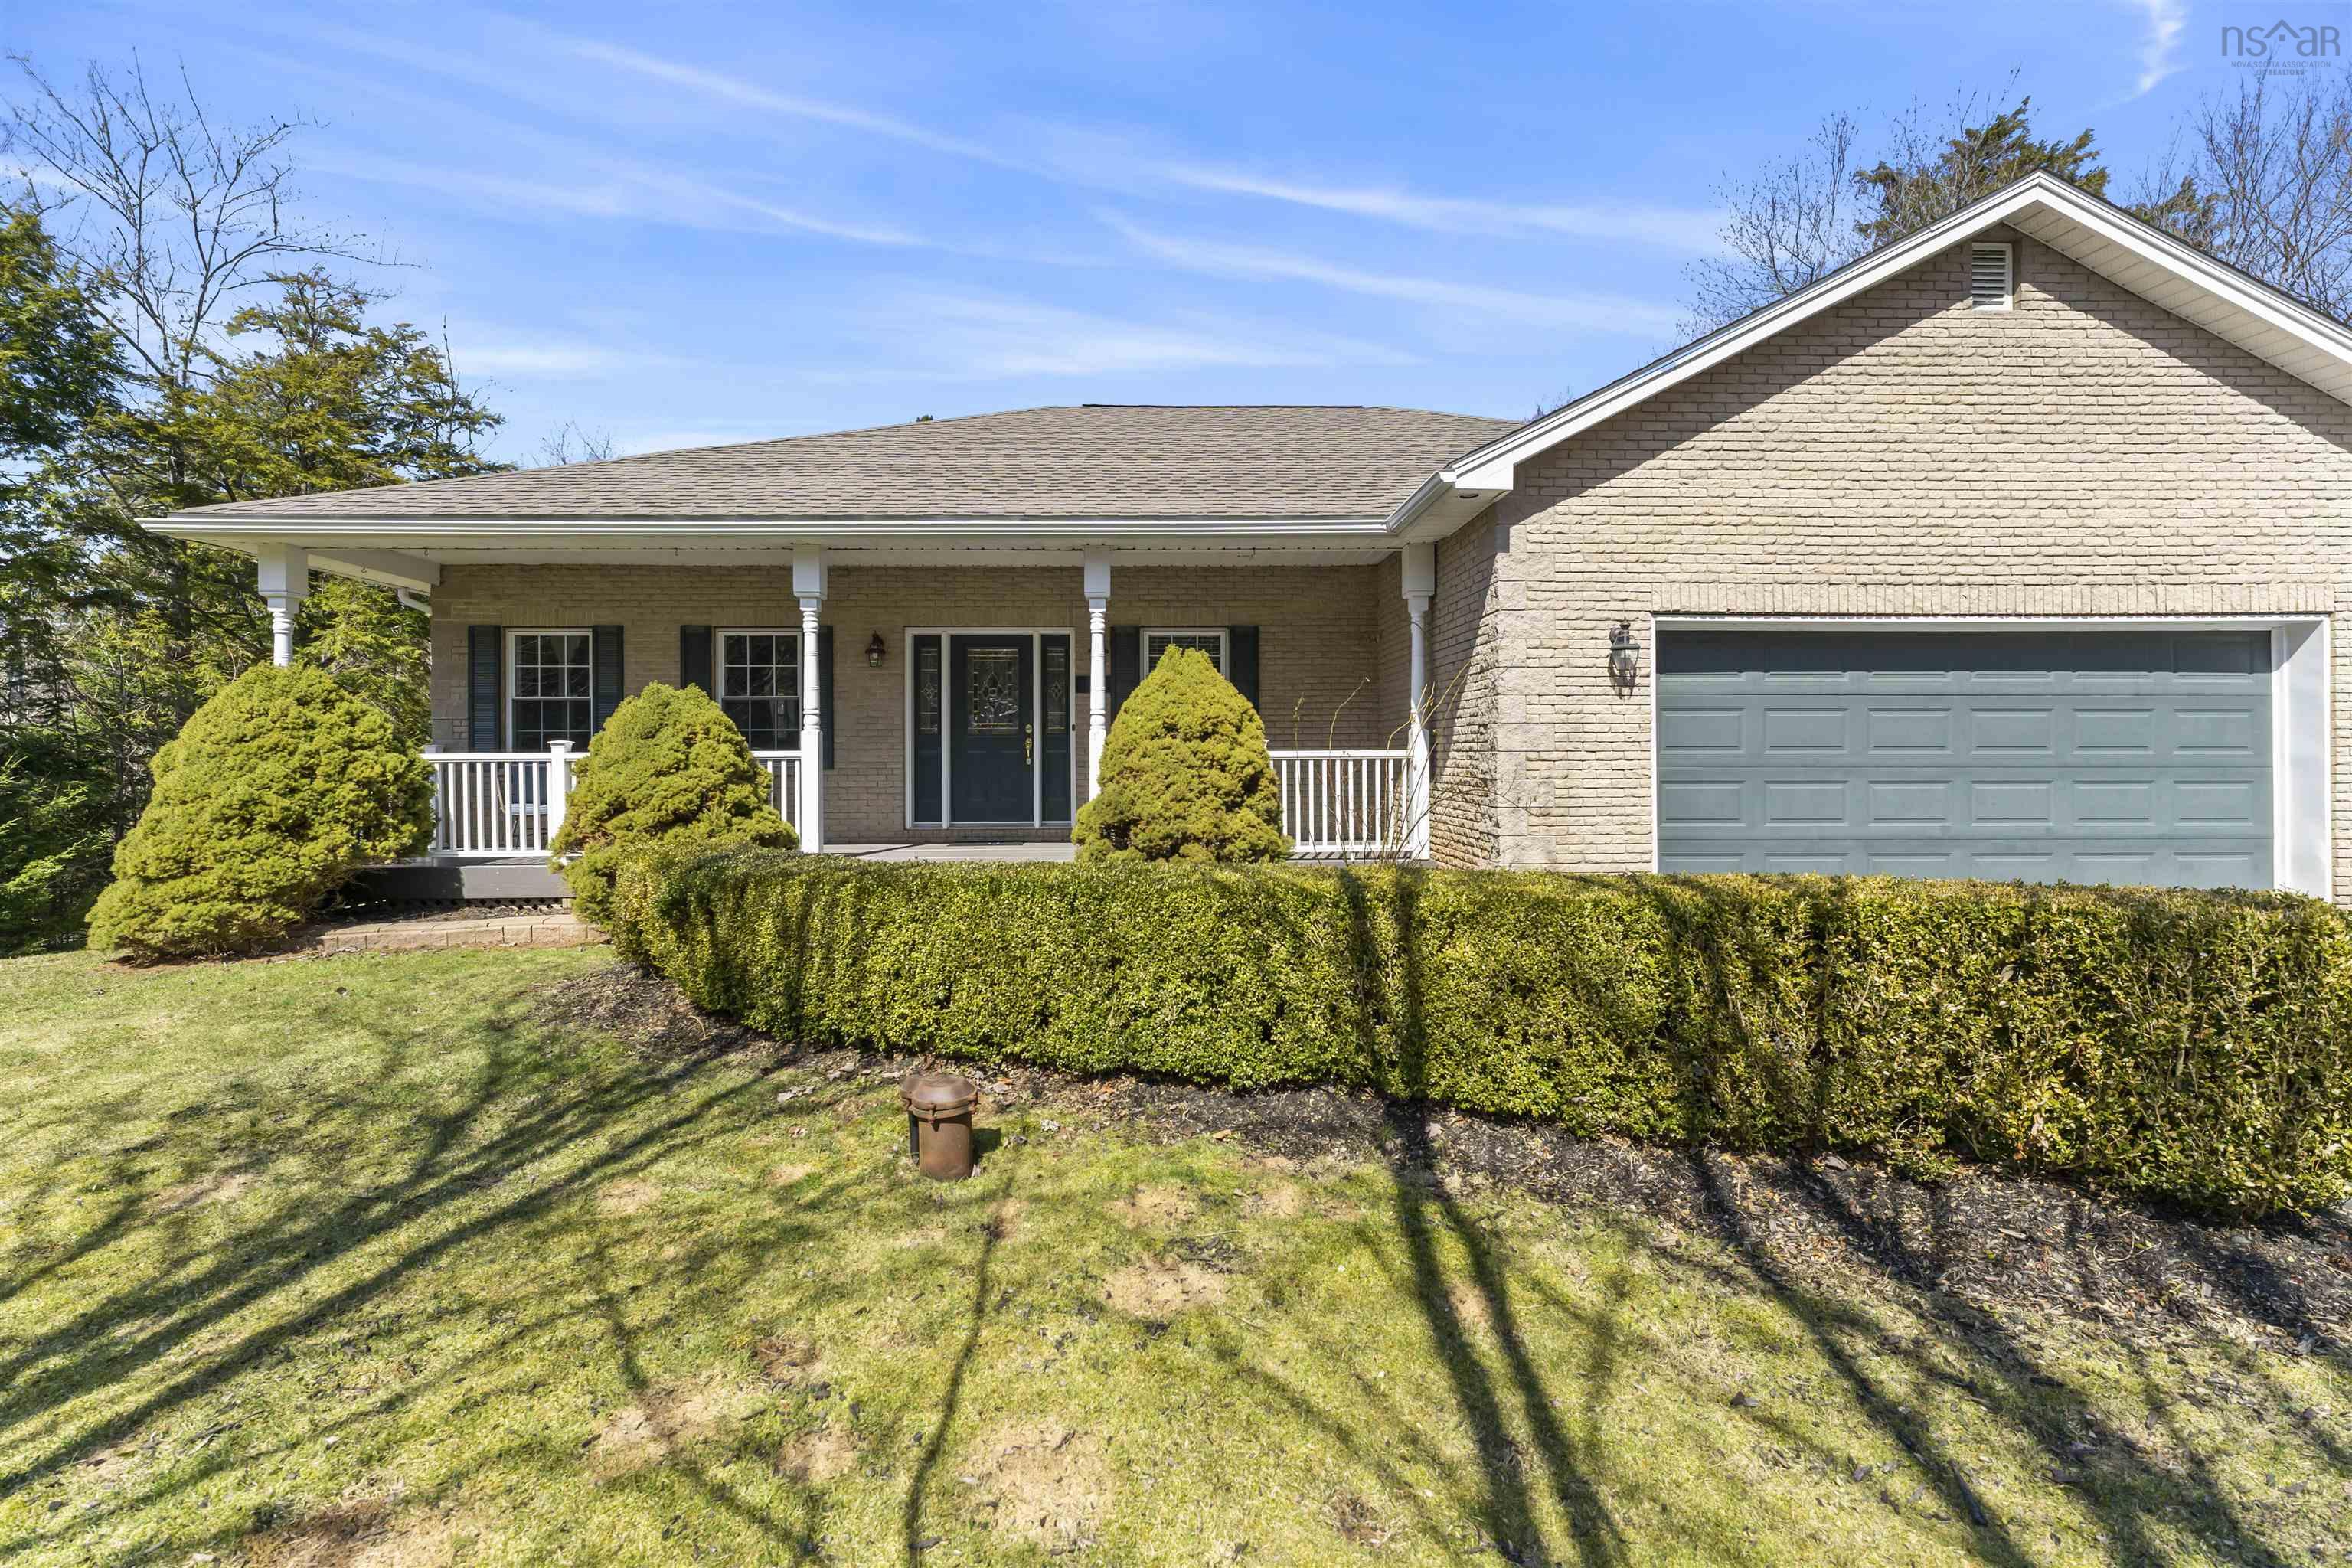
 Welcome to 132 Buckingham Drive. Nestled in the sought-after family neighbourhood of Haliburto…
 Single Family $886,800
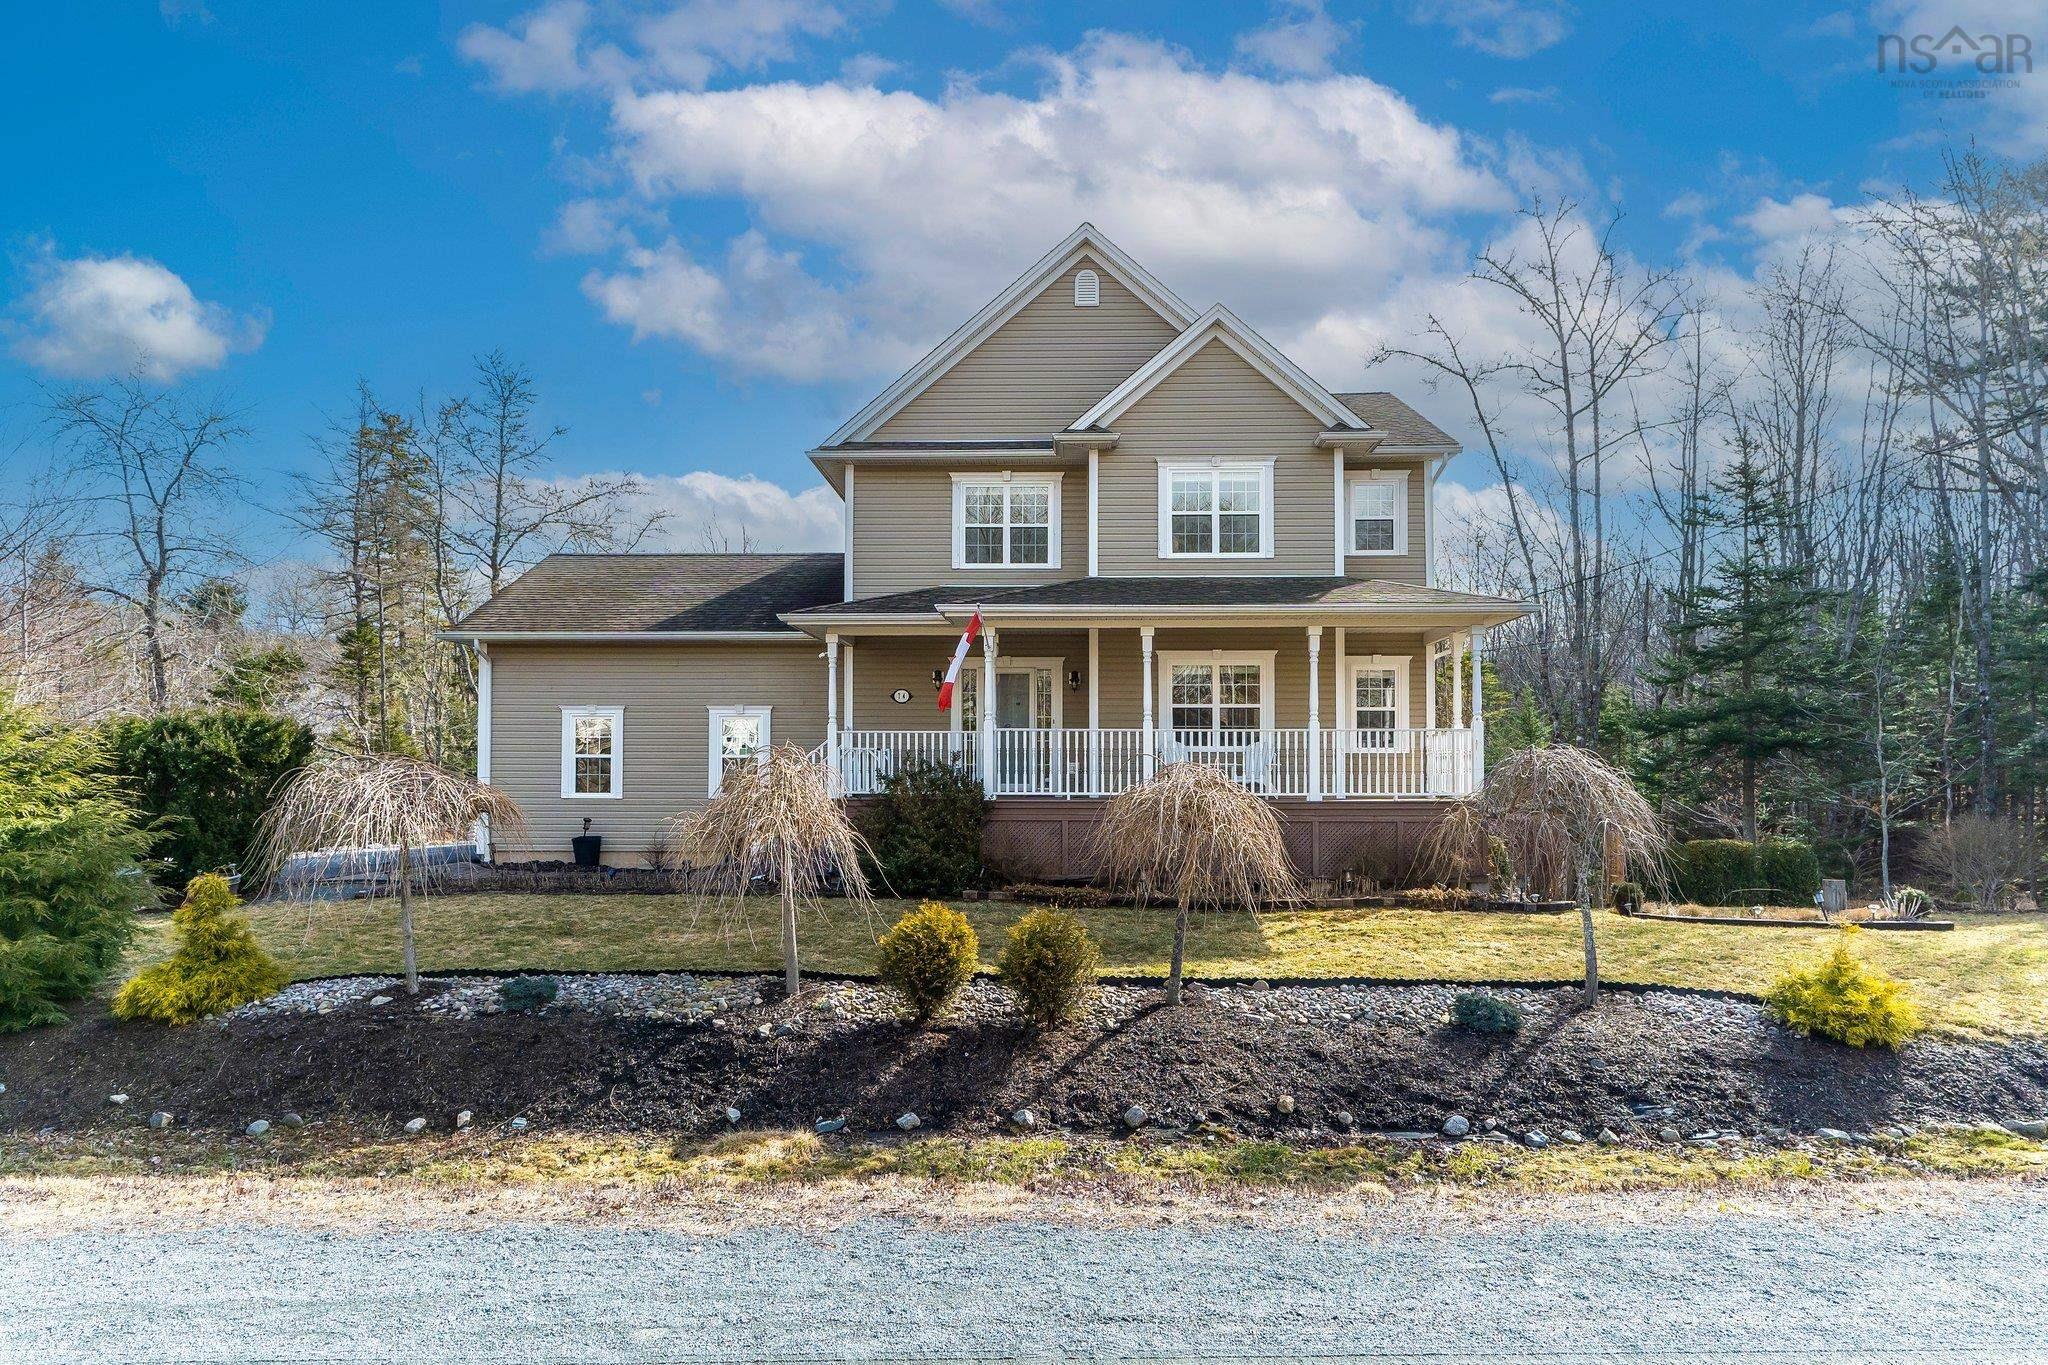
 Turn-Key Home Package in Sought-After Hammonds Plains! An incredible opportunity to build your…
 Single Family $850,000
 Tucked away in the beautiful Glen Arbour community, this spacious family home offers the perfe…
 Single Family $849,900
 Welcome to your forever home in the fantastic community of Stillwater Lake. Spend your morning…